How does measurement system affect Cpk/How to improve according to Cpk analysis
本帖最后由 winda312 于 2013-6-5 19:43 编辑
Use different equipment to measure same 20 pcs samples.
Callipers
4.64
4.64
4.66
4.65
4.63
4.64
4.65
4.63
4.62
4.63
4.64
4.62
4.63
4.64
4.65
4.64
4.63
4.62
4.63
4.64
Projector
4.619
4.632
4.64
4.624
4.627
4.632
4.613
4.62
4.622
4.633
4.638
4.631
4.643
4.634
4.641
4.62
4.61
4.61
4.637
4.62
How does measurement system affect Cpk.
How to improve according to Cpk analysis.
Histogram Chart Comparison
This kind of measurement system can be used for product control only.(But not for the process
control)
The moving range chart also proves that. Measurement system(Callipers) can not tell the difference between parts well.
It really does. Callipers' discrimination is 0.01, while Projector's discrimination is
0.001.
If we perform a MSA, the ndc will be larger than Callipers.
But there are isolated islands (at least 2 peaks) Maybe samples are from different process.(Different
machine/fixture)
The moving range chart also proves this. The difference between parts was detected by the measurement system
(Projector) well.
Cpk comparison
Standard Deviation is almost same. 0.01 vs 0.009
Cpk 1.19 vs 0.98
That's why before Cpk analysis, we'd better perform a MSA analysis. So that we can know the source of the variation.
Since this is cutting process, the easy (economic) way to improve this process is change the mean but not change the standard deviation (Because standard deviation is small enough)
Use different equipment to measure same 20 pcs samples.
Callipers
4.64
4.64
4.66
4.65
4.63
4.64
4.65
4.63
4.62
4.63
4.64
4.62
4.63
4.64
4.65
4.64
4.63
4.62
4.63
4.64
Projector
4.619
4.632
4.64
4.624
4.627
4.632
4.613
4.62
4.622
4.633
4.638
4.631
4.643
4.634
4.641
4.62
4.61
4.61
4.637
4.62
How does measurement system affect Cpk.
How to improve according to Cpk analysis.
Histogram Chart Comparison
- []Callipers Histogram chart shows only 4 types data. But sample is 20 pcs. It means measurement system discrimination is [/]
This kind of measurement system can be used for product control only.(But not for the process
control)
The moving range chart also proves that. Measurement system(Callipers) can not tell the difference between parts well.
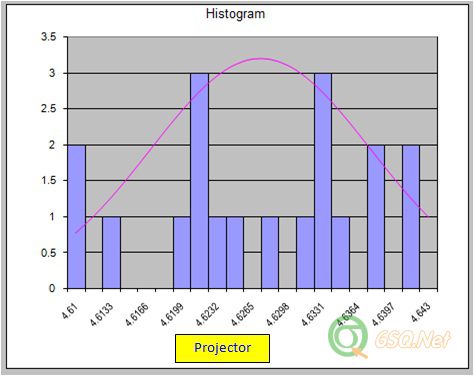
- []Projector Histogram chart shows more types data than Callipers. That means Projector's discrimination is better[/]
It really does. Callipers' discrimination is 0.01, while Projector's discrimination is
0.001.
If we perform a MSA, the ndc will be larger than Callipers.
But there are isolated islands (at least 2 peaks) Maybe samples are from different process.(Different
machine/fixture)
The moving range chart also proves this. The difference between parts was detected by the measurement system
(Projector) well.
Cpk comparison
Standard Deviation is almost same. 0.01 vs 0.009
Cpk 1.19 vs 0.98
That's why before Cpk analysis, we'd better perform a MSA analysis. So that we can know the source of the variation.
Since this is cutting process, the easy (economic) way to improve this process is change the mean but not change the standard deviation (Because standard deviation is small enough)
没有找到相关结果
已邀请:


0 个回复